
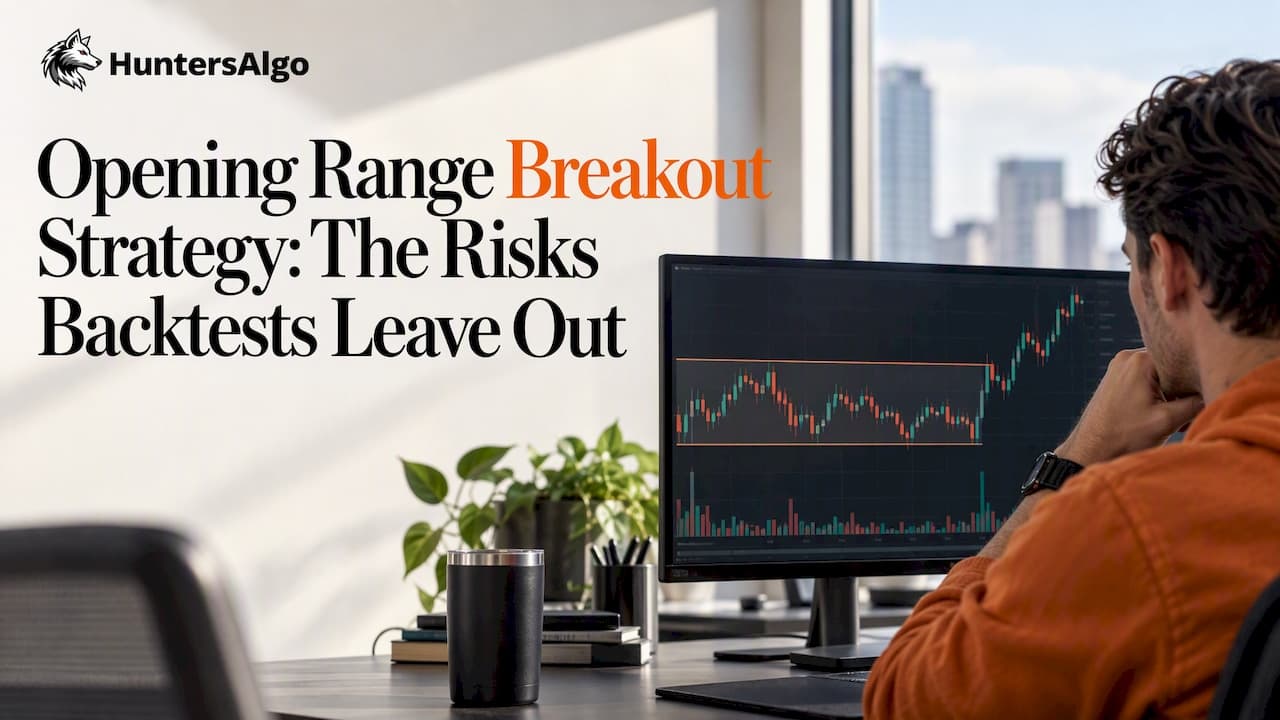
An opening range breakout strategy means entering a trade when price closes outside the high or low of a defined early-session range, typically the first 5 to 30 minutes after the open. It works best when volatility is elevated and the instrument sees genuine participant interest, which is why timeframe and stock selection matter as much as the entry rule itself. The sections below cover setup rules, risk controls, backtest evidence, and the steps to implement it.
TL;DR:
- Equities often use five minute ranges, while index futures use 15 to 30 minutes; longer windows filter noise but sacrifice part of the move.
- Wait for a candle to close beyond the range to limit false signals; entering on the first touch captures moves sooner but reverses more often.
- Equity research found that filtering for high relative volume stocks tied to news improved results, while futures breakouts returned more in high volatility periods.
- Place stops at the opposite edge or use a distance based on volatility, and reduce position size when wider ranges threaten fixed dollar risk.
- Include commissions, slippage, and partial fills in backtests, then compare results across volatility regimes; stop orders may execute beyond their trigger during volatile opens.
Table of Contents
- What is an opening range breakout and why does it work?
- Setup rules: timeframes, entry triggers, and execution mechanics
- Variations and filters: Stocks in Play, ATR thresholds, and early entries
- Risk management and execution realities you need to plan for
- Backtested performance and what the research actually shows
- How to implement an ORB strategy from simulation to live trading
- How HuntersAlgo supports disciplined ORB execution
- When I trade ORB and when I leave it alone
- Simulate and automate your ORB setup with HuntersAlgo
- FAQ
- Sources
What is an opening range breakout and why does it work?
An opening range breakout strategy starts with a simple calculation: pick a timeframe, usually 5, 15, or 30 minutes, and record the highest high and lowest low printed during that window after the session opens. Once that range is set, a breakout happens when price closes above the high (a long signal) or below the low (a short signal).
The logic behind it ties to how markets behave right after the open. Overnight orders, gap reactions, and new information all collide in the first few minutes, and that collision often resolves into a directional push once the initial price discovery settles. A guide to opening-range breakouts describes this early move as a reference point for momentum and for placing protective stops, since the range itself becomes a natural line in the sand.
The duration you choose changes the character of the signal:
- A shorter range (1 to 5 minutes) catches moves earlier but produces more false breakouts from opening noise.
- A longer range (15 to 30 minutes) filters out noise but gives up part of the move before you enter.
- Equities often favor 5-minute ranges, while futures contracts with overnight sessions commonly use 15 to 30 minute windows tied to the cash-market open.
- Illiquid instruments or low-volatility days tend to produce weak, unreliable breakouts regardless of timeframe.
Volatility state and instrument choice end up mattering more than the exact minute count. A tight, quiet range on a dead trading day gives you a coin-flip signal no matter how precisely you measure it.
Setup rules: timeframes, entry triggers, and execution mechanics
Turning the concept into something you can actually test requires exact rules, not a general feel for "breaking out." Here is a sequence you can code or apply manually.
- Choose your opening-range window first: 5 minutes for most equity day trading, 15 to 30 minutes for index futures like ES or NQ.
- Mark the high and low of every bar inside that window as soon as it closes; this becomes your fixed range for the rest of the session.
- Define the trigger as a closed candle beyond the range, not just a wick poking through it, to avoid reacting to a single aggressive print.
- Place a buy-stop order a tick or two above the range high for longs, or a sell-stop a tick or two below the range low for shorts, so the order fills automatically once price confirms.
- Set your initial stop at the opposite side of the range, or at a fixed multiple of the range's size, whichever gives a tighter and more consistent risk per trade.
- Size the position so that the dollar distance between entry and stop equals your predetermined risk amount for that trade.
Some traders use an "early-entry" variant that triggers on the first tick beyond the range rather than waiting for a closed candle. This fills faster and captures more of the move, but it also raises the number of false signals you will sit through, since a quick stab beyond the range often reverses within a bar or two.
On order types, a stop order triggers your entry automatically but can fill at a worse price than expected if the market gaps through your level, something the SEC's guidance on order types specifically flags as a risk during volatile openings. A stop-limit order caps your fill price but risks not filling at all in a fast market. Many traders combine a stop entry with an OCO (one-cancels-other) bracket that places the stop-loss and profit target simultaneously, so neither order needs manual management once you're in the trade.
Position sizing follows directly from your entry and stop: if your account risk per trade is a fixed percentage of capital, divide that dollar amount by the distance from entry to stop to get your contract or share size. A wider opening range means a wider stop, which means a smaller position for the same dollar risk.

Pro Tip: Backtest the closed-candle trigger and the first-tick trigger separately on the same data set. The difference in win rate and average loss will tell you which fits your execution speed and platform.
Variations and filters: Stocks in Play, ATR thresholds, and early entries
Raw opening range breakout rules catch a lot of low-quality signals. Experienced traders layer filters on top to cut down on noise and concentrate on setups with better odds.
- The "Stocks in Play" filter restricts trading to names with unusually high relative volume tied to a fundamental catalyst like earnings or news, and a study on day trading the U.S. equity market found this filter materially improved ORB performance in equities between 2016 and 2023.
- An ATR or range-size filter sets a minimum opening-range width (as a multiple of the instrument's average true range) before a breakout qualifies, which screens out dead, low-volatility sessions that tend to chop.
- Early-entry variants trigger on the first touch beyond the range instead of a closed candle, trading faster fills for a higher rate of false starts and typically pairing with a tighter stop to compensate.
- Futures traders tend to favor volatility and session-based filters since contracts like ES or NQ trade continuously, while equity traders lean on relative-volume and news-driven filters since individual stocks vary enormously in liquidity.
Which filter set works depends on the asset class. Futures benefit from conditioning on recent volatility regime, since the underlying instrument doesn't change day to day. Equities benefit more from filtering the universe itself down to names actually in play that session.
Risk management and execution realities you need to plan for
The gap between a clean backtest and live results almost always comes down to execution. A stop order protects you from unlimited loss, but during a volatile open it can fill meaningfully away from your intended price, a risk the SEC's investor bulletin on order types addresses directly when discussing opening transactions and special order types.
Research shows that returns from opening range breakouts increase with the volatility state of the underlying asset, with high-volatility periods producing substantially higher average returns than low-volatility ones in long-series futures testing. That means the same rule set can look mediocre in a quiet month and strong in a turbulent one, so judging a strategy on a short sample risks drawing the wrong conclusion.
Build these controls into both your backtest and your live execution:
- Model slippage and commissions explicitly in every backtest rather than assuming a perfect fill at your trigger price.
- Set a daily loss limit, in dollars or in number of consecutive losing trades, that forces you to stop trading for the session once hit.
- Choose between a hard stop at the opposite side of the range or a volatility-based stop (a multiple of ATR) depending on which gives more consistent risk across different range widths.
- Size positions as a percentage of account capital, adjusted down when the opening range is wider than usual, so each trade carries comparable dollar risk.
Realistic execution assumptions separate a strategy that looks good on paper from one that holds up with real money. A backtest that ignores partial fills, broker routing, and the price impact of a fast market will overstate performance every time.
Backtested performance and what the research actually shows
Published evidence on opening range breakouts points to a consistent theme: the edge is real but conditional, not constant across every market and every day.
- A study of U.S. equity day trading found that limiting trades to Stocks in Play, names with elevated relative volume tied to news, delivered strong net performance and a solid Sharpe ratio in a portfolio built from the top candidates each day between 2016 and 2023.
- The same research describes timeframe choices as instrument-dependent: a 5-minute opening range is common in equities, while futures markets more often use a 15 to 30 minute session range.
- Separate testing across volatility states in futures found average daily ORB returns substantially higher during high-volatility periods than during low-volatility ones, confirming that the strategy's edge is not evenly distributed through time.
- Longer-run practitioner analysis spanning many decades treats a fixed "stretch" rule, a set fraction of a recent average range with no stop and an exit at the next session's open, as the baseline, with conditioning on recent volatility adding further value on top of that baseline.
A common bias in published backtests is ignoring realistic fill prices and transaction costs, which inflates reported returns relative to what a live account would see. Another is testing on a single instrument or short window and extrapolating the result broadly, when the volatility-dependence findings above suggest performance should be measured across different regimes, not averaged into one number.
| What the research covers | Key finding |
|---|---|
| Stocks in Play filter (US equities, 2016 to 2023) | Materially improved net performance versus unfiltered ORB source |
| Volatility-state dependence (futures, long series) | High-volatility periods show substantially higher average ORB returns source |
| Timeframe conventions by asset class | 5-minute common in equities, 15 to 30 minute common in futures source |
The practical takeaway: structure your own backtest to tag each trade with the volatility regime it occurred in, then review performance by regime rather than as one blended average. That single change will tell you more about whether the strategy fits your market than any aggregate win rate.
How to implement an ORB strategy from simulation to live trading
Moving from an idea to a working system follows a predictable sequence. Skipping steps here is where most traders lose money they didn't need to lose.
- Gather clean historical price data at the bar interval you plan to trade (1-minute data at minimum, so you can construct any opening-range length from it).
- Build your opening-range bars by aggregating the first N minutes of each session into a single high and low, then code the breakout trigger exactly as you'll trade it live.
- Run an out-of-sample backtest that includes realistic slippage, commissions, and partial fills, and log every trade's entry, exit, and timestamp for later review.
- Forward-test the strategy in a simulated account for a meaningful stretch of live sessions, tracking win rate, average win versus average loss, and maximum drawdown as you go.
- Move to live trading only after simulation results match your backtest closely enough that the gap is explained by normal variance, not by a flawed assumption.
On NinjaTrader 8 or TradingView, the parameters you'll want to expose for testing include the opening-range length, entry trigger type (closed-candle versus first-tick), stop placement method, and position-size calculation, so you can adjust each one without rewriting your core logic.
Pro Tip: Keep a separate trade log tagged by volatility regime from day one. It turns a vague sense of "the strategy felt off lately" into a specific, checkable pattern.
How HuntersAlgo supports disciplined ORB execution
We provide automated strategies designed to help reduce emotional interference from trade execution, which matters most during the fast, high-stakes minutes right after the open. Our strategy library includes The Philosophers, a set of session-specific systems covering morning reversal and afternoon continuation techniques built for volatile market conditions.
Every strategy includes published backtesting results and configuration options designed to be approachable, so traders can test a setup in simulation before risking live capital. That means you can see how a given rule set performed historically and adjust parameters like range length or stop placement before committing a single trade live.
When I trade ORB and when I leave it alone
I trade an opening range breakout strategy when the instrument shows elevated volatility and genuine volume, and I skip it on quiet, range-bound days when the setup is statistically weaker. I layer it alongside mean-reversion and trend-following systems on other timeframes so a single bad regime for breakouts doesn't sink the whole account. The lesson that holds up across every variation: the edge comes from consistent rules and consistent execution, not from reading more into any single trade.
— charlie
Simulate and automate your ORB setup with HuntersAlgo
We offer ready-built ORB variants, backtest reproduction tools, and NinjaTrader and TradingView setup guides so you can test before you commit.

- Review plan pricing starting at $49.99 per month, with a 3-day trial before billing begins.
- Try the free setup guide to configure your platform in minutes.
- Verify results yourself with the backtest reproduction helper.
FAQ
How profitable is the opening range breakout strategy?
Profitability depends heavily on volatility state and instrument selection rather than being a fixed number. Research on futures found average returns substantially higher during high-volatility periods than during low-volatility ones, and equity research found filtering to Stocks in Play materially improved results.
Which opening range breakout indicator is the best?
There is no single best indicator; most traders rely on a simple range-marking tool that plots the high and low of the chosen opening window directly on the chart. What matters more than the indicator itself is the entry trigger and filter rules layered on top, such as a closed-candle confirmation or an ATR-based volatility filter.
What is the 5-minute opening range breakout strategy and how does it work?
A 5-minute ORB measures the high and low of the first five minutes after the open, then triggers a long on a close above that high or a short on a close below that low. It's one of the most common timeframes in equity day trading, according to research comparing timeframe conventions, since it balances early entry against opening noise.
Which breakout strategy is best?
The strongest approach combines a clear range definition, a confirmed entry trigger, and a filter like relative volume or volatility threshold rather than trading every breakout signal unfiltered. Platforms like HuntersAlgo publish backtested results for strategies such as The Philosophers so you can compare approaches before choosing one.
What should I check before choosing an ORB trading system?
Look for published backtest results that disclose slippage and commission assumptions, a simulation mode to test before going live, and configurable parameters for range length and stop placement. Confirm the system logs trades with timestamps and volatility tags so you can review performance by regime rather than as one blended average.